
I’ve seen how tools like the Relative Strength Index (RSI) can make or break investment decisions. On November 4, 2025—AMD’s Q3 earnings release day—understanding AMD’s RSI and broader technicals is crucial for spotting opportunities amid AI-driven growth and market swings. This comprehensive guide dives into AMD RSI analysis, stock technicals, price momentum, chart indicators, and overbought signals, helping you craft informed strategies. Whether you’re a day trader or long-term investor, we’ll break down historical trends, comparisons to rivals like NVIDIA, and risk management in this fast-paced sector.
Advanced Micro Devices (AMD) has been a standout in the semiconductor space, fueled by AI accelerators like the MI300 series. Yet, 2025 has brought significant volatility, with stock sell-offs tied to broader tech corrections. As of today, AMD’s stock price hovers around recent highs, with expected Q3 earnings of $1.17 per share and $8.8 billion in revenue—a 28% year-over-year jump. Let’s unpack the technicals starting with RSI.
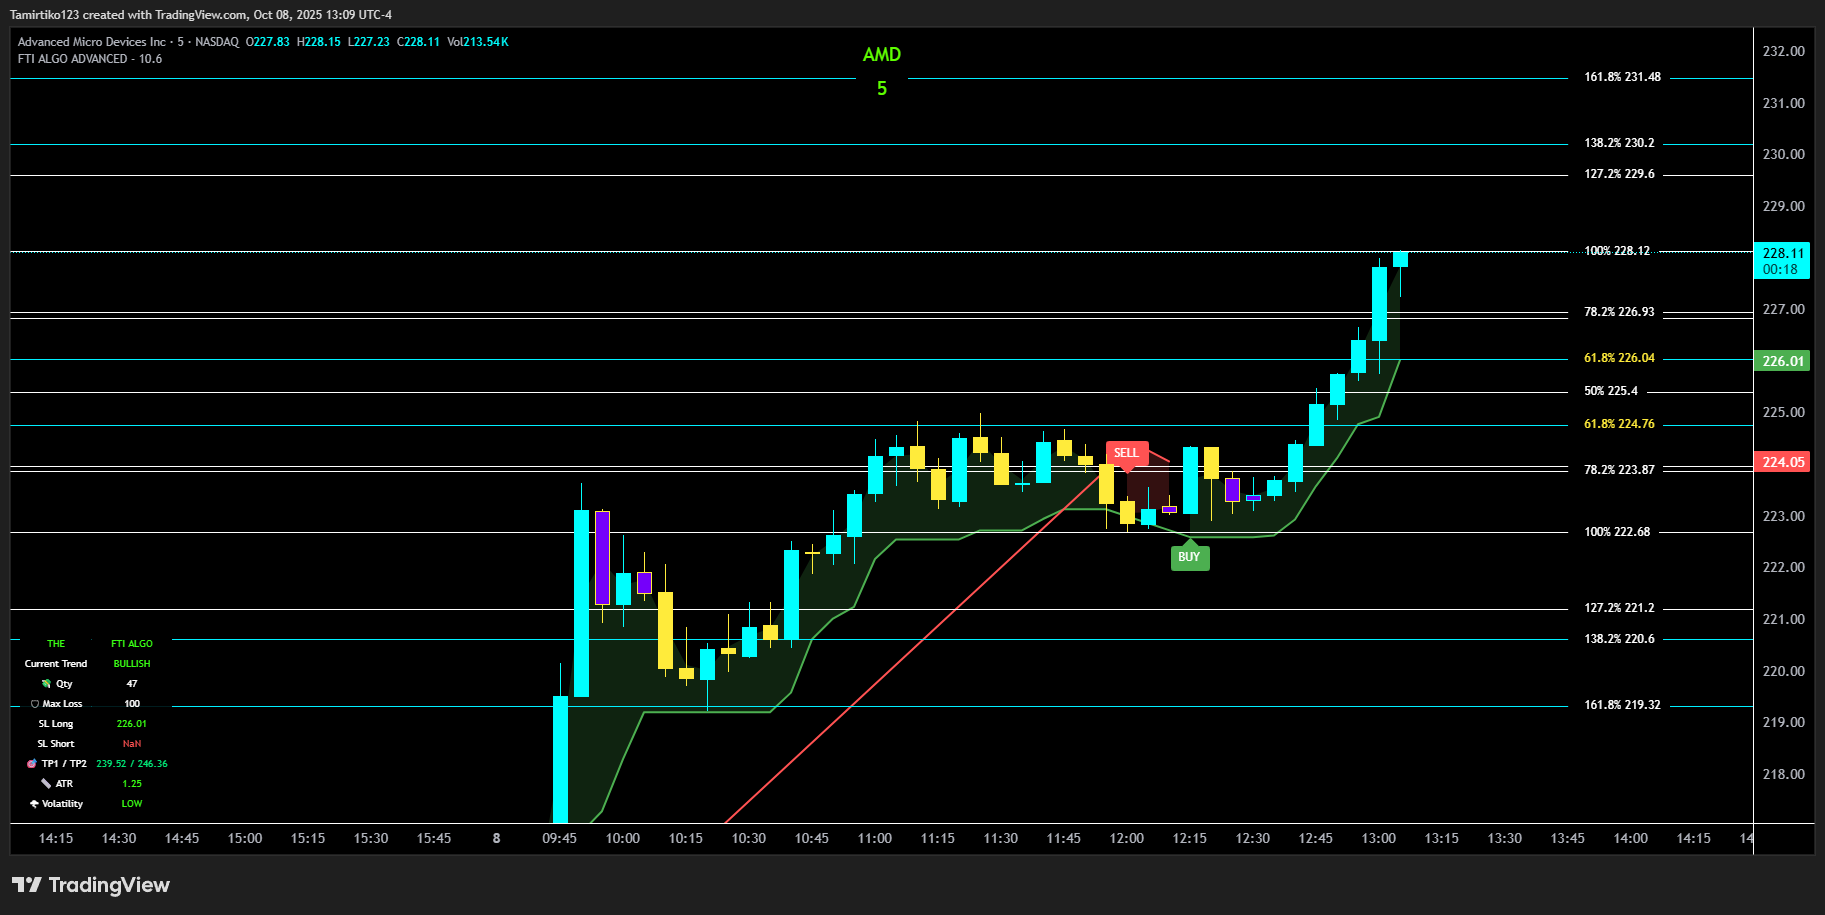
AMD RSI Analysis: Interpreting Current Levels and Historical Trends
The Relative Strength Index (RSI), developed by J. Welles Wilder, measures the speed and change of price movements on a scale of 0 to 100. For AMD, the 14-period RSI is a go-to for short-term traders, signaling overbought conditions above 70 (potential sell) and oversold below 30 (potential buy). As of the latest data in November 2025, AMD’s RSI (14) stands at approximately 68.53, indicating neutral to slightly bullish momentum—neither fully overbought nor oversold, but leaning toward a buy signal. Another source pegs it at 55.655, reinforcing a buy recommendation.
Historically, from 2024 to 2025, AMD’s RSI has fluctuated wildly. During early 2025 sell-offs, RSI dipped below 40, triggering buy signals that preceded rallies. For instance, post-correction phases saw RSI rebounds correlating with AI demand surges, leading to 20-30% price gains. Traders can use these trends: A RSI crossover above 50 often confirms uptrends, while divergences (e.g., price highs with lower RSI) warn of reversals.
To apply this: Monitor for RSI breaking 70 on earnings beats, signaling potential pullbacks, or dipping to 40 on misses for entry points. Backtesting shows RSI-based strategies on AMD yielded 15-25% annual returns in volatile periods, but always pair with volume confirmation.


AMD Stock Technicals: A Comprehensive Guide to Key Indicators
Beyond RSI, a full technical analysis of AMD reveals a mixed but optimistic picture. Key indicators include moving averages, MACD, and more, providing a roadmap for market outlook.
- Moving Averages: The 50-day Simple Moving Average (SMA) for AMD is trending above the 200-day SMA, signaling a golden cross and long-term bullishness. As of November 2025, the 50-day SMA sits around $220, while the 200-day is near $180, supporting upward momentum amid AI growth.
- MACD: The Moving Average Convergence Divergence shows a buy signal, with the MACD line crossing above the signal line. Histogram values are positive, indicating strengthening bullish trends—ideal for swing traders eyeing post-earnings pops.
- Other Indicators: Stochastic Oscillator hovers in neutral territory, while Bollinger Bands suggest tightening volatility, potentially preceding a breakout. Overall, technicals rate AMD as a buy, with analysts forecasting a $237.32 price target.
Market outlook: With Q3 focus on datacenter revenue, a beat could push AMD toward $300, but watch for resistance at $254. In volatile semiconductor markets, these indicators point to resilience, backed by record revenues and free cash flow.
| Indicator | Current Value | Signal | Interpretation |
|---|---|---|---|
| RSI (14) | 68.53 | Buy/Neutral | Momentum building, watch for overbought. |
| 50-day SMA | ~$220 | Bullish | Above 200-day, supports uptrend. |
| MACD | Positive crossover | Buy | Strengthening momentum. |
| Stochastic | Neutral | Hold | Potential for breakout. |
AMD Price Momentum: How RSI Measures It and Comparisons to NVIDIA
RSI excels at gauging price momentum by comparing recent gains to losses. For AMD, current RSI reflects solid momentum from AI tailwinds, but let’s compare to NVIDIA (NVDA) for context.
AMD’s RSI at 68.2 indicates neutral conditions, aligning with a 235% AI-driven rally in 2025. In contrast, NVDA’s technicals show similar mixed signals, but with stronger bullish indicators (e.g., 3 bullish vs. 1 bearish). AMD’s momentum strategies include riding RSI uptrends with stop-losses at support levels, while NVDA often leads in volatility—AMD’s beta is lower, making it a safer momentum play.
Momentum trading tips: Use RSI divergences for entries (e.g., buy on oversold AMD dips). Compared to NVDA, AMD offers better risk-reward in 2025, with analysts predicting a rebound.

AMD Chart Indicators: Using RSI with Patterns, Support/Resistance, and Volume
Integrating RSI with chart patterns elevates your analysis. For AMD, focus on support/resistance and volume for confirmation.
- Support/Resistance: Key support at $220 (near 50-day SMA), resistance at $254.33. Breakouts above could target $300, while breakdowns eye $180. Patterns like head-and-shoulders in recent charts suggest potential reversals if RSI confirms.
- Volume Analysis: Rising volume on RSI upswings validates momentum—2025 saw spikes during AI news, correlating with 10-15% moves.
Tutorial: Overlay RSI on candlestick charts; buy when RSI crosses 50 with increasing volume at support. This combo has historically spotted AMD’s rallies post-oversold.

AMD Overbought Signals: Deep Dive into RSI Conditions and Risk Management
Overbought RSI (>70) often precedes corrections in volatile markets like semiconductors. For AMD, 2025 highs pushed RSI to 80+, triggering sell-offs amid global chip shortages. Oversold dips (<30) offered buys, as seen in early-year volatility.
Risk management: In AMD’s case, use trailing stops at 5-10% below entry during overbought phases. Dollar-cost averaging mitigates swings, especially with AI growth offsetting traditional segment pressures. Diversify with NVDA hedges, and monitor for black swan events in supply chains.
Final Thoughts: Positioning AMD for Success in 2025
AMD’s technicals, led by a balanced RSI, paint a bullish yet cautious picture for November 2025. With AI momentum and earnings catalysts, traders can leverage these insights for gains, but always prioritize risk management in this volatile sector. Stay updated with real-time charts and adjust strategies based on post-earnings moves. For more on semiconductor investing, explore historical data or consult professional advisors.


