

Understanding which process is associated with a specific window is essential for effective system management and troubleshooting across various operating systems.
Whether you’re a developer debugging an application, a system administrator monitoring system performance, or a user seeking to resolve software conflicts, identifying the process behind a window provides valuable insights into system operations.
This tutorial offers a comprehensive guide to determining the process associated with any window across macOS, Windows, and Unix/Linux platforms. We explore both graphical user interface (GUI) tools and command-line utilities, catering to different user preferences and expertise levels.
By following these methods, you can gain a deeper understanding of your system’s behavior and enhance your ability to manage running applications effectively.
By utilizing the appropriate method for your operating system, you can efficiently identify the processes behind active windows, facilitating better system management and problem resolution.
Windows: Using Task Manager to Identify the Process Name and PID of a Window
Task Manager is a built-in Windows tool that provides a simple and accessible way to identify the process name and PID associated with a specific window. This method is ideal for users who prefer a graphical interface and requires no additional software or commands.
However, Task Manager groups certain applications (like web browsers) under a single entry in the “Processes” tab. For example, individual tabs or windows in browsers such as Chrome or Edge may not appear as separate entries. In such cases the Process Explorer method below can help.
-
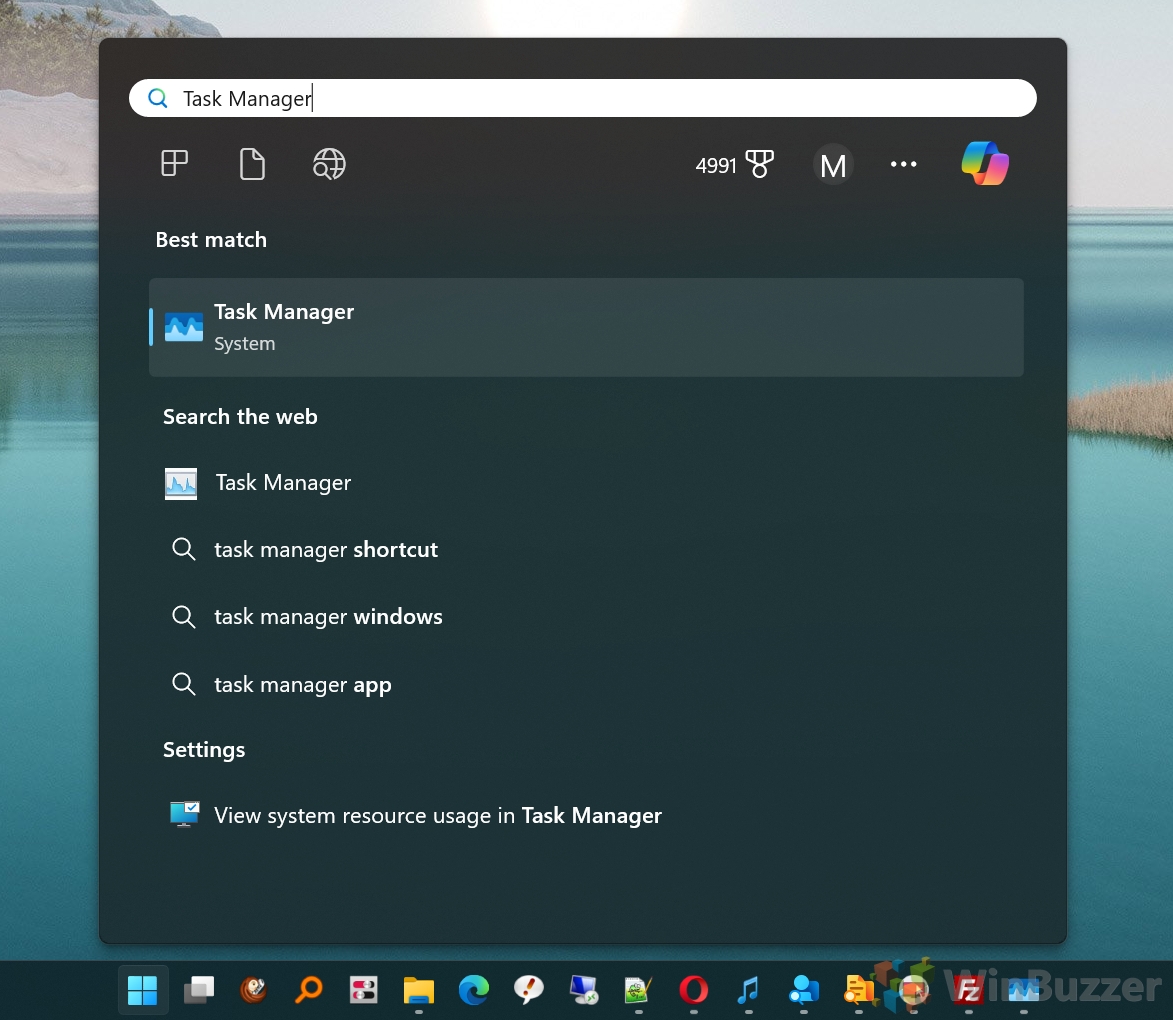
Open Task Manager
PressCtrl + Shift + Escto open Task Manager directly. Alternatively, right-click on the taskbar and select “Task Manager”, or open it via Windows Search.

-
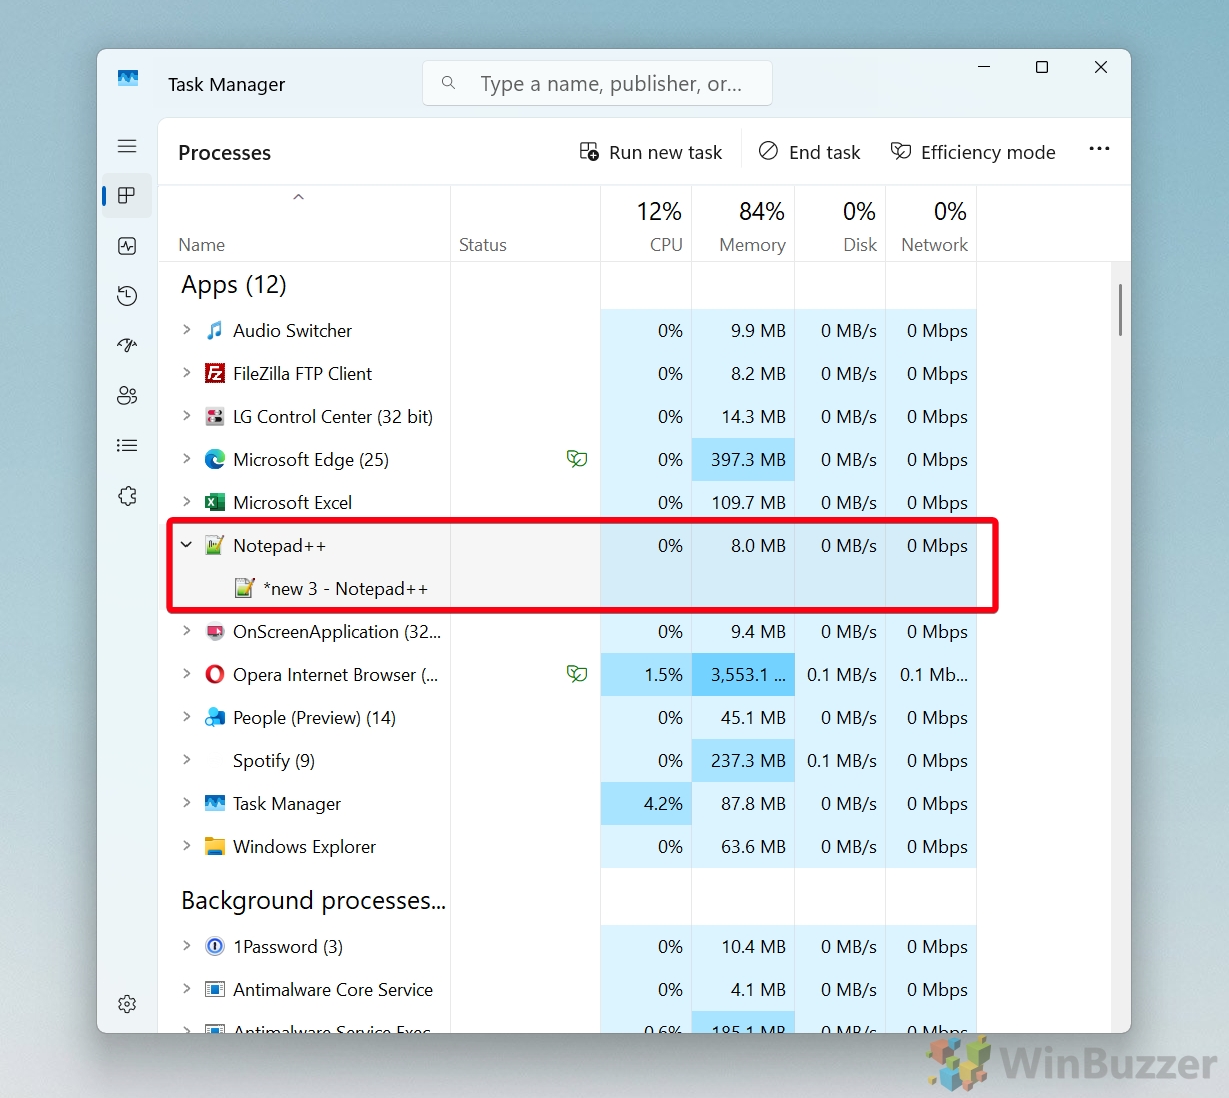
Find the Target Window in the Processes Tab
Locate the application associated with the target window under the “Processes” tab. If necessary, expand the application group to view individual windows. If you cannot identify the application process, use the Process Explorer method below instead.
-
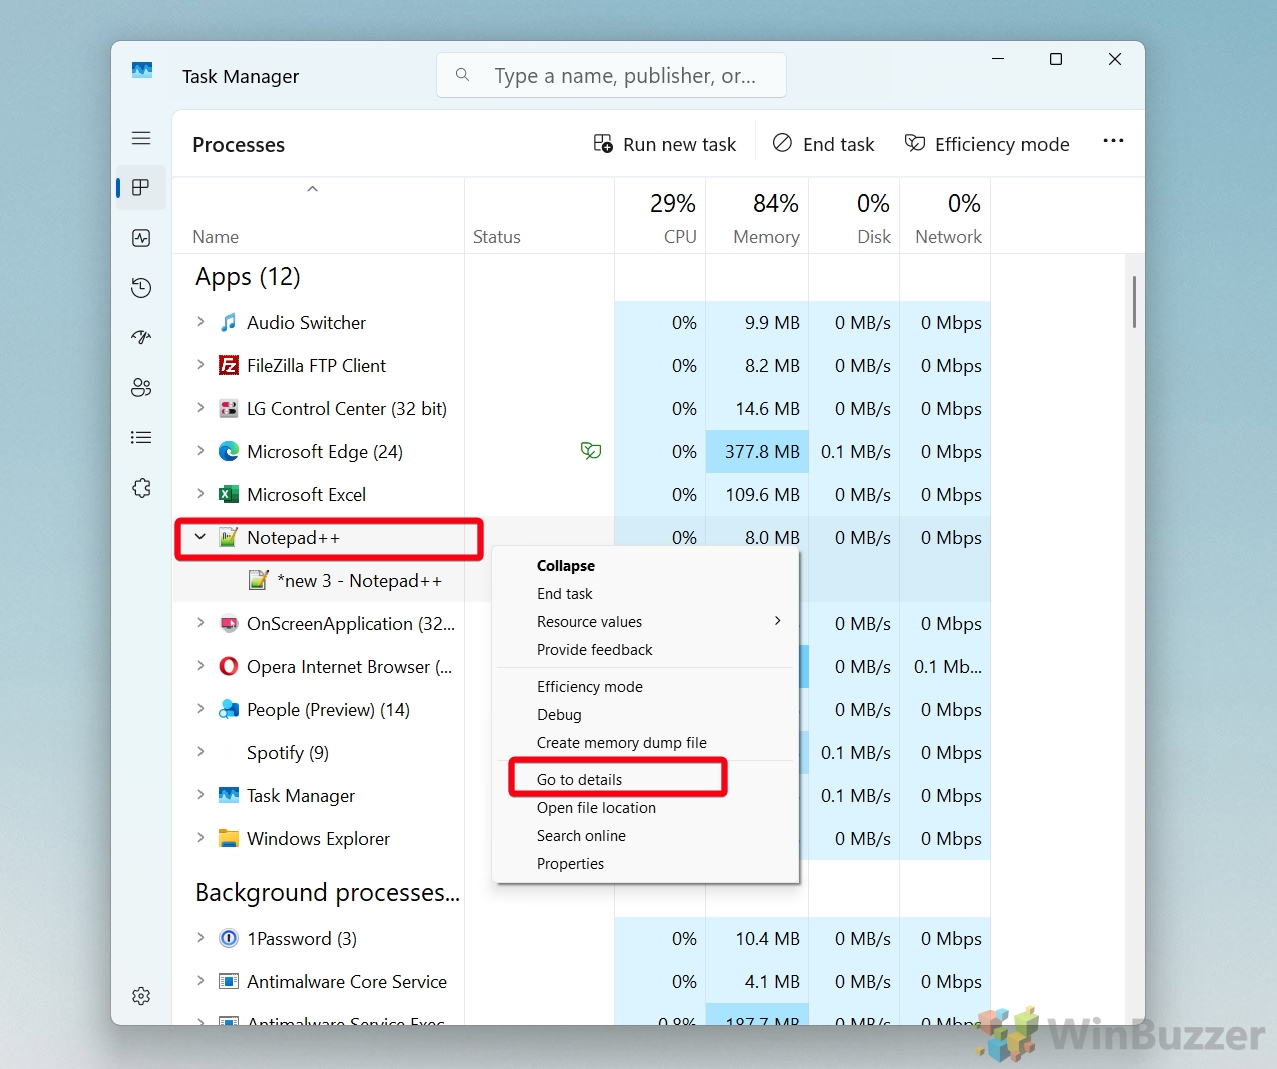
Go to the Process Details
Right-click on the application or window entry and select “Go to Details” from the context menu.
-
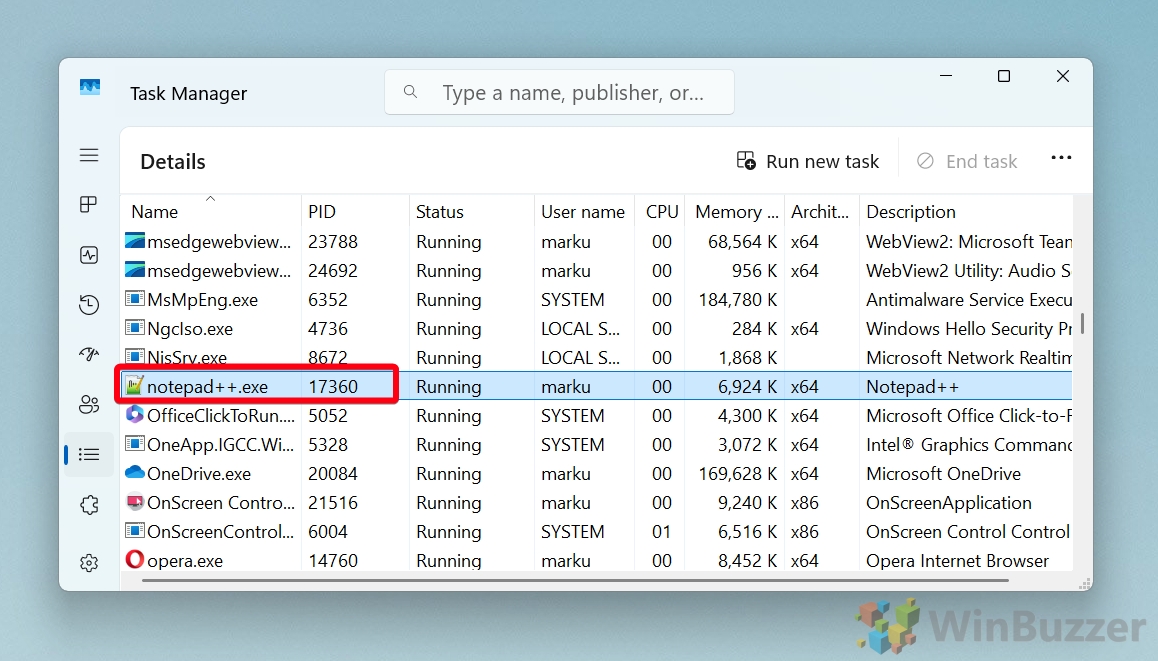
View Process Name and PID
The corresponding process name and PID will be highlighted in the “Details” tab.
Windows: Using Process Explorer to View Parent and Child Processes of a Window
Process Explorer, a tool from Microsoft’s Sysinternals suite, allows users to explore parent-child relationships between processes. This is particularly useful for understanding how a specific window or application is tied to system processes and their dependencies.
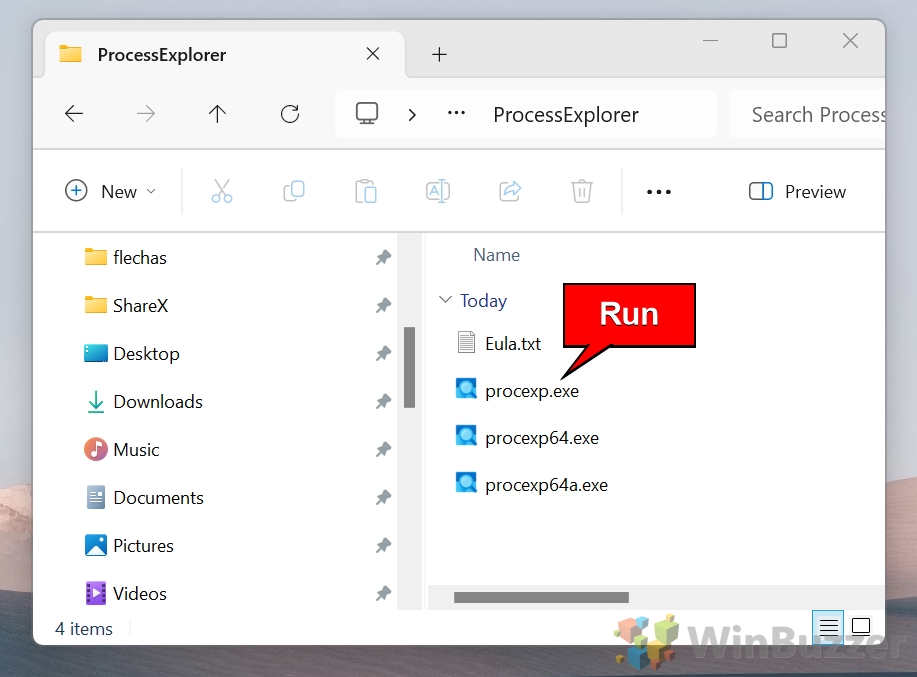
- Download and Launch Process Explorer
Download Process Explorer from the Microsoft Sysinternals website. Extract the downloaded file and launch procexp.exe. It’s a portable application, so no installation is necessary.
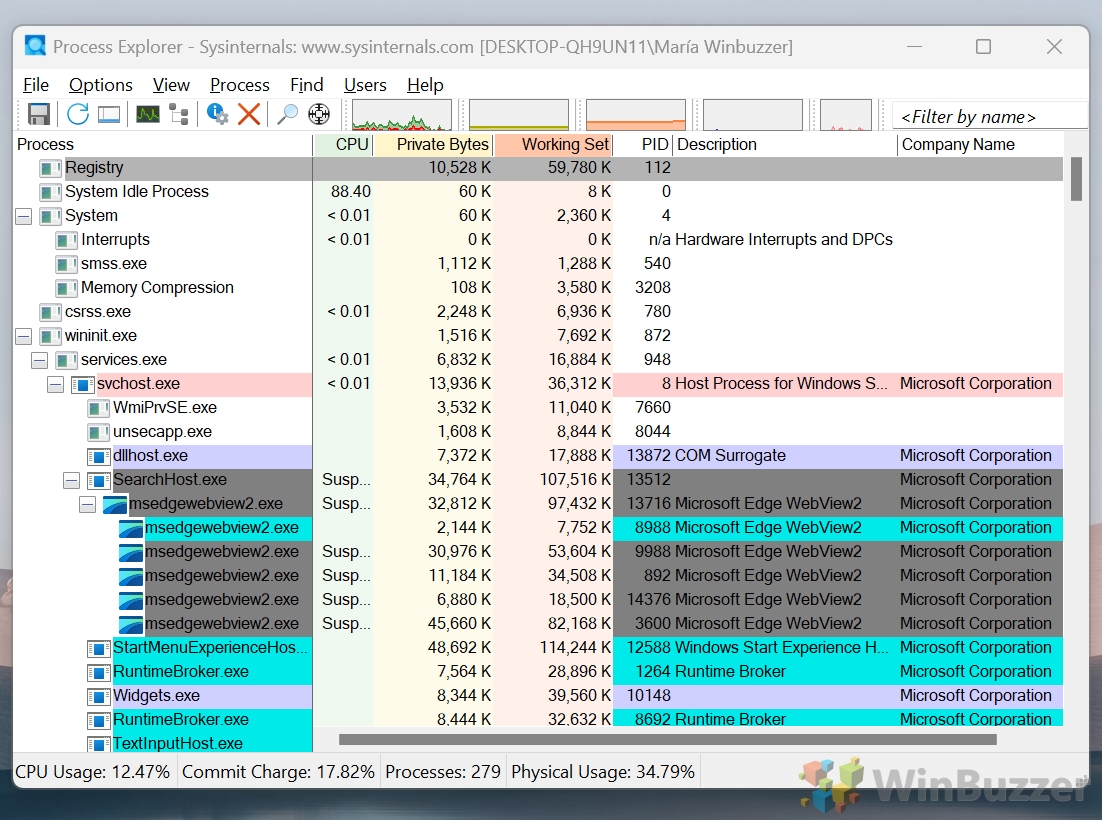
- Locate the Target Process
Open Process Explorer, where you’ll see a hierarchical tree of all running processes.
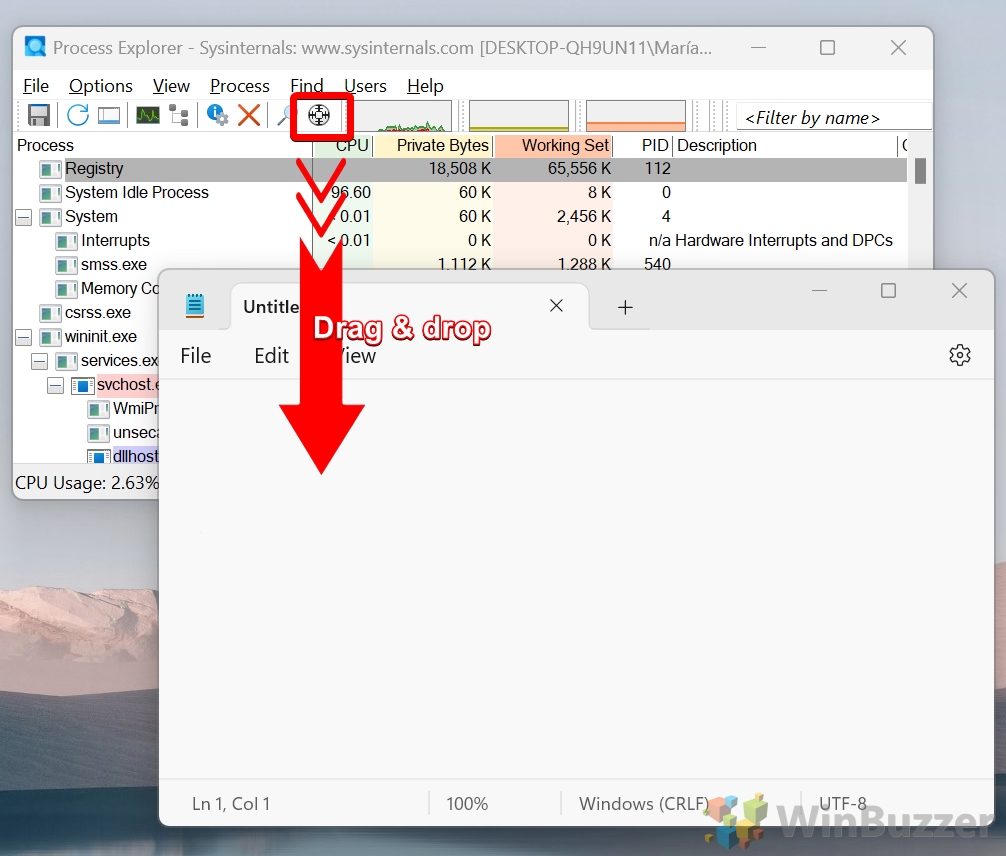
- Use the Find Window’s Process tool (crosshair icon in the toolbar)
Drag and drop the crosshair onto the target window.
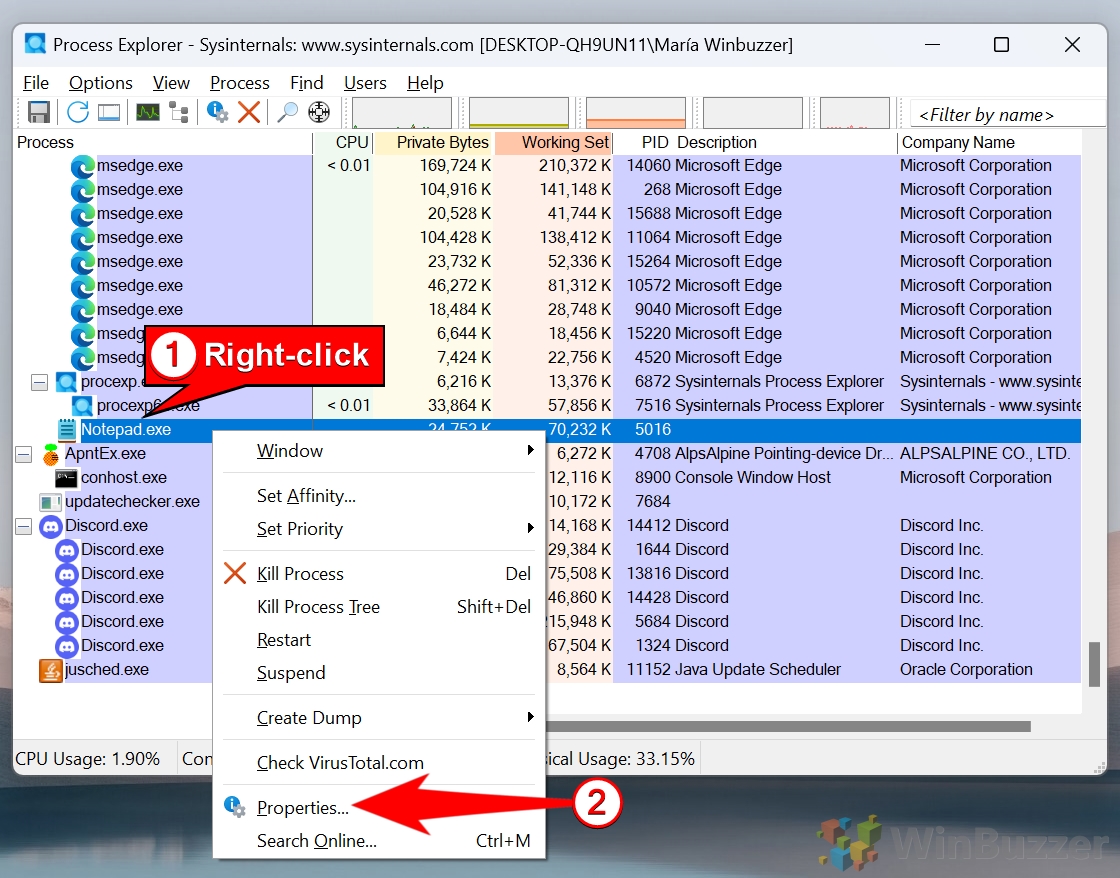
- View Parent and Child Processes and Show Process Properties
Look at the tree structure to identify parent and child processes for the highlighted process:
Parent processes appear directly above the highlighted process.
Child processes are indented beneath the highlighted process.
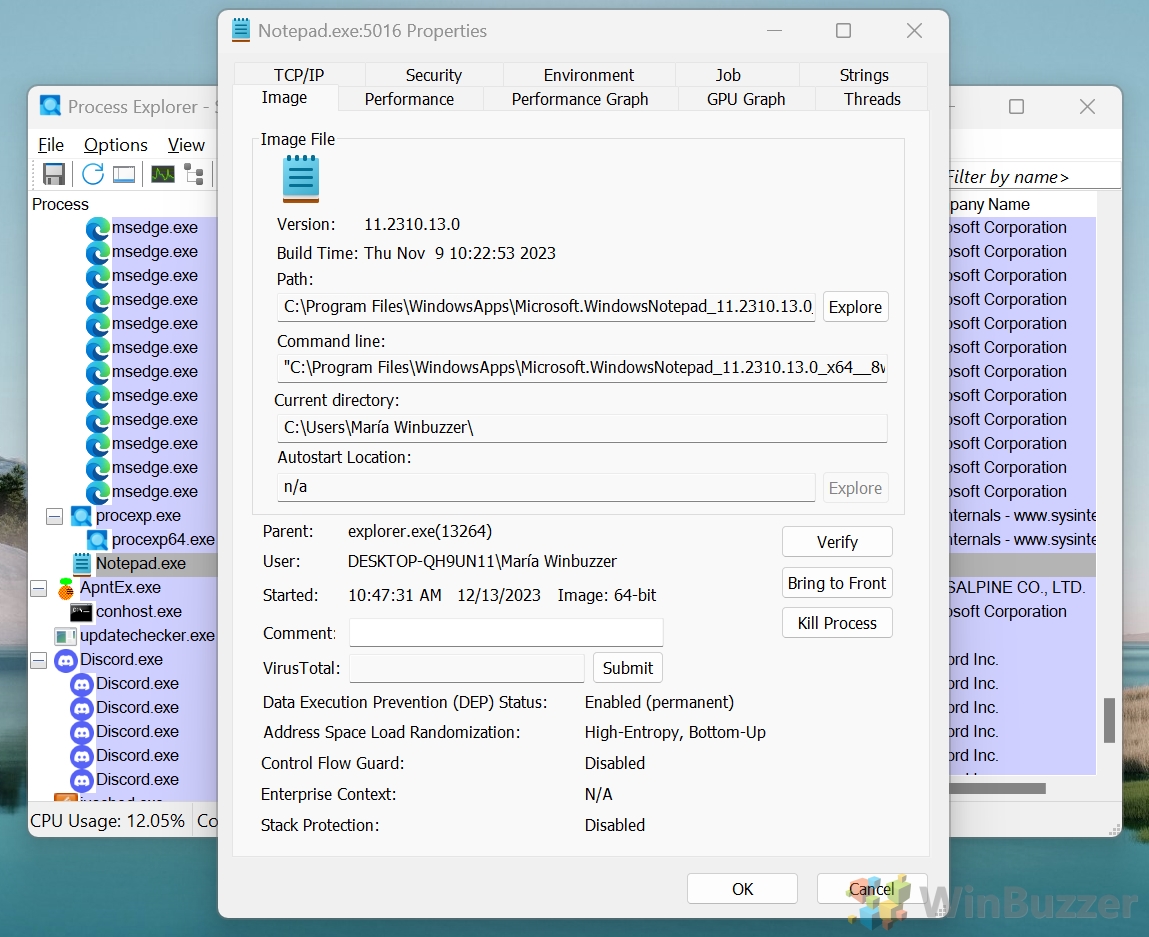
Right-click on the target process and select “Properties” from the context menu.
- Inspect Process Properties
Navigate to the “Image” tab to view the process’s executable path and command-line arguments.
Switch to the “Performance” tab to monitor the process’s resource usage in real time.
- Analyze Dependencies (Optional)
For additional context, click on the “Threads” tab in the Properties window. The Threads tab provides insights into the threads running within the process.
Windows: Using the “tasklist” and “findstr” Commands
If you prefer command-line tools, Windows provides the tasklist and findstr commands to identify the process associated with a specific window. Both commands are built into Windows, offering a quick and resource-efficient way to identify processes. This method is particularly useful for advanced users who are comfortable with the command line.
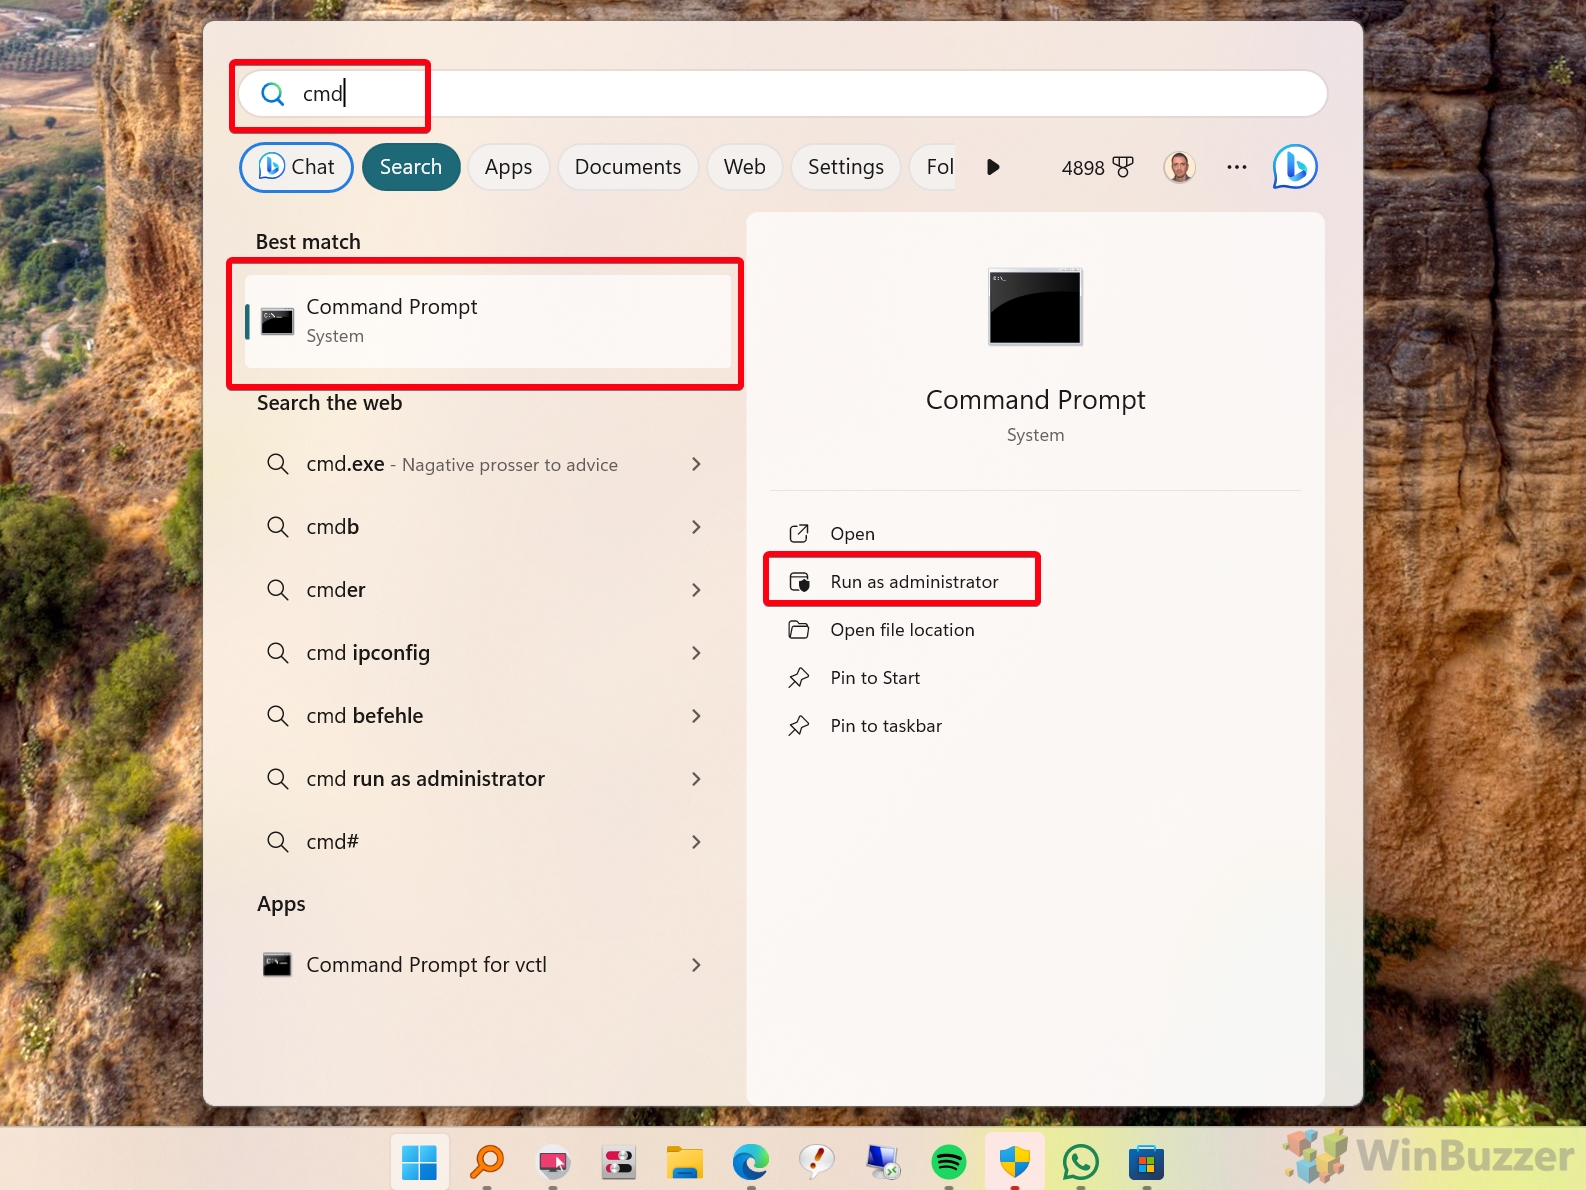
- Open Command Prompt
Press “Win + R”, type “cmd”, and press “Enter” to open the Command Prompt (CMD).
- List Active Processes
Use the “tasklist” command to list all running processes:
tasklist /v
- Search for the Target Window
Use the “findstr” command to filter the output for a specific window title. The result displays the process associated with the specified window. Replace window_title with the title or a part of the title of the target window:
tasklist /v | findstr "window_title"
Example:
tasklist /v | findstr "Notepad"
- Note the Process ID
Locate the “Process ID (PID)” in the command output. It appears in the second column. For example:
Image Name                     PID Session Name        Session#    Mem Usage    Window Title
notepad.exe                   1234 Console             1          6,788 K      Untitled - Notepad
- Gather Additional Process Information (Optional)
To gather more details about the process, use the PID with the “tasklist” command:
tasklist /fi "pid eq 1234"
Example output:Image Name PID Session Name Session# Mem Usage ========================= ======== ================ =========== ============ notepad.exe 1234 Console 1 6,788 K
macOS: Using Accessibility Inspector from Xcode
The Accessibility Inspector is a developer tool included in Apple’s Xcode suite. It allows users to visually identify the details of UI elements, including their associated process. This method is ideal for macOS users who prefer a graphical interface instead of command-line solutions.
- Install Xcode
If Xcode is not already installed:
– Open the App Store on your macOS device.
– Search for “Xcode” from Apple and click “Get” or “Install”.
– Wait for the installation to complete. - Launch Accessibility Inspector
– Open Xcode from the Applications folder or Spotlight search.
– Navigate to “Xcode” > “Open Developer Tool” > “Accessibility Inspector”.
The Accessibility Inspector window will appear, ready to inspect UI elements. - Activate “Point to Inspect” Mode
In the Accessibility Inspector, click the Point to Inspect button (a crosshair icon). Hover your mouse pointer over the target window. The Accessibility Inspector will display detailed information about the UI element, including its owning application and process ID (PID). - Confirm Process Details
Look for the “Application” field in the Inspector’s sidebar. It will display the name of the application associated with the window. If more details are needed, cross-reference the application name with its PID in the Terminal using the ps command:
ps -e | grep "ApplicationName"
macOS: Using A Python Script
Our downloadable python script allows macOS users to identify the process associated with a specific window by detecting window movements. This method is useful for developers, system administrators, or users troubleshooting application behavior.
- Download the Script
Download the zipped script “identify_moved_window_pid_on_macOS.py” from our server. Save it to a convenient location on your macOS system, such as your Downloads folder and unpack the script. - Make the Script Executable
Open Terminal and navigate to the folder containing the script:
cd /path/to/script
Modify the file permissions to make it executable. This ensures the script can be executed without unnecessary permissions:
chmod 740 identify_moved_window_pid_on_macOS.py
- Execute the Script
Run the script from the Terminal, and within 3 seconds, move the window you wish to inspect. The script captures the event and identifies the process associated with the moved window:
./identify_moved_window_pid_on_macOS.py
- View the Output
The Terminal displays the Process ID (PID) and command associated with the target window. The output provides detailed information about the process, including its PID, execution path, and runtime. For example:
Moved window belongs to process with ID (PID): 94464
Process information ('ps -p 94464'):
  PID TTY           TIME CMD
94464 ??         8:06.88 /System/Applications/Utilities/Activity Monitor.app/Contents/MacOS/Activity Monitor
Linux: Using the xprop Command
The “xprop” command is a Unix/Linux utility that allows users to retrieve detailed information about X11 windows. This method is commonly used for identifying the process ID (PID) of a specific window in graphical desktop environments like GNOME, KDE, or Xfce.
xprop is lightweight and straightforward, making it an efficient choice for Unix/Linux users who need quick insights into the ownership of a specific window. It’s particularly useful in debugging and troubleshooting graphical environments.
- Install xprop
If xprop is not installed, use your package manager to add it:
sudo apt install x11-utils   # For Debian/Ubuntu
sudo yum install xorg-x11-utils  # For Fedora/Red Hat
- Launch xprop
Open a Terminal window and execute the following command. The command waits for you to click on a window to retrieve its details:
xprop _NET_WM_PID
- Select the Target Window
Hover your mouse over the desired window and click on it. The Terminal will display the process ID (PID) associated with the selected window. For example:
_NET_WM_PID(CARDINAL) = 923
- Find Additional Process Information
Use the retrieved PID to find detailed information about the process in Terminal:
ps -p 923 -o pid,ppid,cmd
Example output:
PID  PPID CMD
923  854  /usr/lib/firefox/firefox
FAQ – Frequently Asked Questions About Identifying and Managing Processes
1. How do I list all running processes in Windows?
Open Command Prompt by pressing Win + R, typing cmd, and pressing Enter. Then, use the following command: tasklist This will display all running processes, including their names, PIDs (Process IDs), session names, session numbers, and memory usage. For more detailed information, use the /v flag: tasklist /v This provides additional details, such as the status of each process and the associated window title.
2. How do I identify services running as processes in Windows?
To list all services and their states, open Command Prompt and use the sc query command: sc query This will display all services, their state (e.g., running, stopped), and their service names. For more targeted information, use: sc queryex type=service Alternatively, in Task Manager, switch to the Services tab to view services and their associated processes. Right-click any service to open additional options, such as starting, stopping, or viewing properties.
3. How can I monitor a specific process in Windows?
Open Resource Monitor by pressing Win + R, typing resmon, and pressing Enter. Navigate to the CPU tab, where you’ll see all active processes. To monitor a specific process, search for its name or PID in the search box under Associated Handles. Resource Monitor provides real-time metrics, such as CPU usage, memory consumption, and disk activity for the selected process.
4. How do you find which process is using a file in macOS?
Use the lsof command in Terminal to locate the process accessing a specific file: lsof | grep "file_name" Replace “file_name” with the name of the file you want to check. The output will display the PID, process name, and other relevant details of the processes using the file. Ensure you have the necessary permissions to view this information.
5. How can I get the process information of a window on macOS without Xcode?
Open Terminal and use the ps command to find the PID and process details for the application owning the window: ps -e | grep "ApplicationName" Replace “ApplicationName” with the name of the app. If you don’t know the exact name, use the Activity Monitor app to identify the process and its PID visually.
6. How do I see processes by ID on macOS?
Use the ps command with the -p flag to filter by PID: ps -p PID Replace PID with the target process ID. The output includes the command used to start the process, its parent process ID (PPID), and other relevant details. To see more information, use: ps -fp PID
7. How do I find which process is using a specific port in Linux?
Use the lsof command to determine which process is using a specific port: sudo lsof -i :port_number Replace port_number with the desired port (e.g., 80 for HTTP). Alternatively, use netstat to check: netstat -tuln | grep port_number Combine this with the ps command to get more details about the process, such as its execution path: ps -p PID
8. How do I check if a process is running in Linux?
Use the ps command with the PID or process name to check if a process is active: ps -p PID ps -e | grep "process_name" If the process is running, its details will appear in the output. For real-time monitoring, use the top or htop commands, which dynamically update process status and resource usage.
9. How do I view files opened by a process in Linux?
Use the lsof command with the process’s PID to list all files the process has open: lsof -p PID The output will include files, network connections, and sockets associated with the process. To view specific types of files (e.g., regular files or network connections), use filters such as: lsof -p PID | grep "REG"
10. How do I find which processes are consuming the most CPU in Linux?
Use the top command to view a live, sorted list of processes by CPU usage. To get a more user-friendly interface, install and run htop: sudo apt install htop htop Both tools allow you to sort processes by CPU or memory usage dynamically, making it easy to identify resource-heavy processes.