6 Powerful Ways GPU-Z Lets You Monitor Your Graphics Card Like a Pro
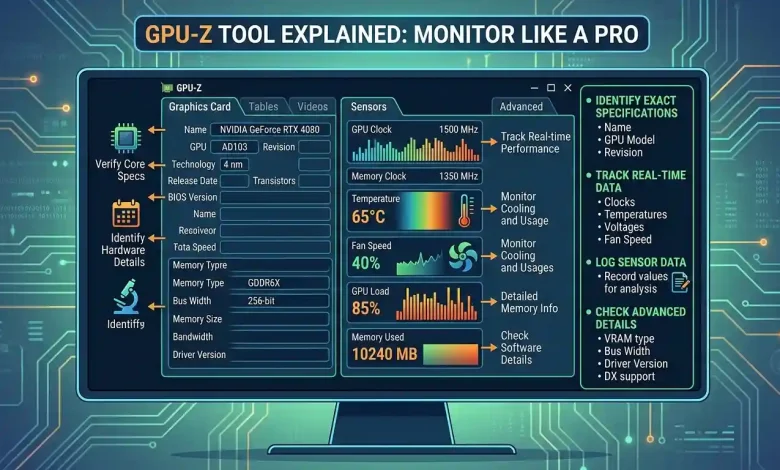
Table of Contents
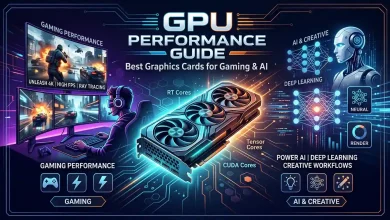
GPU-Z Tool Explained: Monitoring your graphics card like a pro is no longer a task reserved solely for hardware experts. In today’s demanding digital landscape, understanding the intricate workings of your Graphics Processing Unit (GPU) is crucial for optimal performance, system stability, and even troubleshooting. Whether you’re a passionate gamer pushing the limits of graphical fidelity, a content creator rendering complex scenes, or simply an enthusiast curious about your hardware, a robust monitoring tool is indispensable. Among the myriad of utilities available, TechPowerUp’s GPU-Z stands out as a lightweight, yet incredibly powerful application designed to provide comprehensive, real-time information about your graphics card.
This article will delve deep into GPU-Z, exploring its features, explaining how to interpret its data, and demonstrating why it’s a go-to tool for anyone looking to gain professional-level insight into their GPU’s health and performance. We’ll cover everything from installation to advanced monitoring techniques, ensuring you can leverage this utility to its fullest potential.
What is GPU-Z? An Essential Overview
At its core, GPU-Z is a specialized, free, and lightweight system utility that offers an in-depth analysis of your graphics processing unit. Developed by TechPowerUp, a renowned resource in the IT hardware community, GPU-Z acts as a diagnostic and information tool, much like its CPU counterpart, CPU-Z. It provides accurate, real-time specifications and sensor data for a wide range of graphics devices, including those from NVIDIA, AMD, ATI, and Intel. This tool is particularly valued because it is read-only, meaning it retrieves information without making any modifications to your hardware or requiring driver installations, making it safe and portable.
The primary purpose of GPU-Z is to equip users with vital statistics about their video cards and GPUs. It displays critical details such as the GPU model, its internal codename, manufacturing technology process, chip die size, and the number of transistors. Beyond static specifications, GPU-Z excels in providing dynamic, real-time sensor data, which is crucial for monitoring your GPU’s behavior under various loads. This includes parameters like GPU core clock, memory clock, temperature, fan speed, and GPU load. For PC builders, overclockers, technicians, and support staff, GPU-Z is an invaluable asset for verifying GPU identity, diagnosing thermal throttling, confirming memory bandwidth, and cross-referencing details against manufacturer documentation.
Downloading and Installing GPU-Z: Getting Started
One of GPU-Z’s appealing aspects is its simplicity of acquisition and deployment. The tool can be downloaded directly from the official TechPowerUp website. It’s a small application, typically just a few megabytes, and offers both an installer version and a portable executable. Many users prefer the portable version, as it requires no installation, leaves no traces in the system registry or program files, and can be run directly from a USB drive, making it ideal for quick diagnostics across multiple machines.
To download:
- Visit the TechPowerUp GPU-Z download page.
- Select a download server, typically one closest to your geographic location.
- Download the executable file (e.g.,
GPU-Z.exe).
For installation (if you choose the installer):
- Run the downloaded executable.
- Follow the simple on-screen wizard. This will place the program in your Start menu and create shortcuts.
For portable use:
- Simply double-click the downloaded
GPU-Z.exefile. The application will launch directly.
Upon its first launch, you might encounter a prompt to install it or launch it directly. Choosing “Not now” or “Run” will open the application in portable mode. The interface is very user-friendly, with information organized into several tabs, making navigation straightforward.
Navigating the Graphics Card Tab: Your GPU’s DNA
The “Graphics Card” tab is the default view when you open GPU-Z and serves as a comprehensive identification sheet for your GPU. It presents a wealth of static information about your graphics card’s hardware, firmware, and driver.
Here’s a breakdown of the key information you’ll find:
- Name: The commercial name of your graphics card (e.g., NVIDIA GeForce RTX 4080, AMD Radeon RX 7900 XTX).
- GPU: The internal codename of the GPU chip (e.g., AD103 for RTX 4080).
- Technology: The manufacturing process node (e.g., 5 nm, 7 nm).
- Die Size: The physical size of the GPU chip in square millimeters.
- Release Date: The official release date of the GPU model.
- BIOS Version: The firmware version of your graphics card. This is critical for verifying vBIOS flash success.
- Device ID: Unique identifier for the GPU.
- Subvendor: The manufacturer of your specific card (e.g., ASUS, MSI, Gigabyte).
- Bus Interface: Indicates the PCIe version and number of lanes your GPU uses (e.g., PCIe 4.0 x16). It also shows the actual lanes currently in use, which can be useful for diagnosing bandwidth limitations.
- Memory Type: The type of VRAM (e.g., GDDR6, GDDR6X).
- Memory Size: The total amount of dedicated video memory on your card.
- Memory Bus Width: The width of the memory interface in bits, which, combined with memory speed, determines memory bandwidth.
- Driver Version: The currently installed graphics driver version and its release date.
- Default Clock / GPU Clock / Memory Clock / Boost Clock: These display the factory-set clock speeds, the current actual clock speeds, and the advertised boost clock speeds for the GPU core and memory. Note that the main tab shows a kind of base clock, not always the actual clock which can be found in the sensor tab.
- DirectX Support: The highest DirectX version supported by your GPU.
- Shaders: The number of shader units.
- ROPs / TMUs: Render Output Units and Texture Mapping Units.
- OpenCL / CUDA / PhysX / Vulkan: Indicates support for these various computing APIs and technologies.
Each textbox in this tab often includes tooltips that provide more detailed explanations of the displayed information when you hover over them. This tab is particularly reliable as it sources data directly from the GPU firmware and PCIe configuration, making it excellent for verifying hardware authenticity and specifications.
Unveiling the Sensor Tab: Real-time Insights
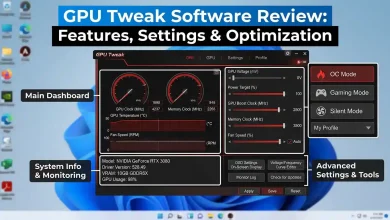
While the “Graphics Card” tab offers static details, the “Sensors” tab is where GPU-Z truly shines for real-time monitoring. This tab presents a dynamic stream of data that updates continuously, usually every second by default, offering critical insights into your GPU’s operational health and performance under load.
Key metrics available on the Sensors tab include:
- GPU Temperature: This is one of the most vital metrics, indicating the current thermal state of your GPU. High temperatures can lead to thermal throttling, reducing performance and potentially shortening the lifespan of your card. GPU-Z also often reports junction temperatures and memory temperatures for a more granular view.
- GPU Core Clock: The real-time clock speed of your GPU’s processing core. This will fluctuate based on the workload and thermal conditions.
- GPU Memory Clock: The real-time clock speed of your GPU’s video memory.
- GPU Load: Expressed as a percentage, this indicates how much of your GPU’s processing capability is currently being utilized. High load (e.g., 99-100%) during gaming means your GPU is working hard, while low load might suggest a CPU bottleneck or other system limitations.
- Memory Used: Shows the amount of VRAM currently being consumed by applications and games. Monitoring this helps ensure you’re not exceeding your VRAM capacity.
- VDDC (GPU Voltage): The voltage supplied to the GPU core. Monitoring voltage is particularly useful for overclockers and those looking to undervolt their GPUs.
- Power Consumption: Often shown as a percentage of the total power limit, this indicates how much power your GPU is drawing. Some tools can display this in Watts. Exceeding 100% can indicate the card is trying to draw more power than its set limit, potentially leading to downclocking.
- Fan Speed: Displays the current speed of your GPU’s cooling fans, usually in RPM or as a percentage of their maximum speed. Essential for assessing cooling effectiveness.
- Bus Interface Load: Monitors the utilization of the PCI Express bus, which can highlight potential data transfer bottlenecks between the GPU and system memory.
The “Sensors” tab also allows for customization. You can choose which sensors are active and adjust the update interval from 0.1 seconds to 10 seconds. Furthermore, GPU-Z has a logging feature that allows you to save all sensor readings to a text file (CSV format) for later analysis, which is invaluable for long-term performance tracking or troubleshooting.
| GPU-Z Metric | Description | Why It Matters |
|---|---|---|
| GPU Temperature | Current temperature of the GPU core (often also memory/junction). | Indicates thermal health; high temps lead to throttling and potential damage. |
| GPU Load | Percentage of GPU processing power currently in use. | Reveals if GPU is fully utilized or if a bottleneck exists elsewhere. |
| Core Clock (MHz) | Real-time clock speed of the GPU core. | Directly impacts performance; fluctuates with load and temperature. |
| Memory Clock (MHz) | Real-time clock speed of the GPU’s video memory. | Affects memory bandwidth and data transfer rates. |
| Memory Used (MB/GB) | Amount of dedicated video memory currently allocated. | Helps identify VRAM limitations for specific applications. |
| Fan Speed (%) / (RPM) | Speed of the GPU cooling fan(s). | Indicates cooling system effectiveness; high RPM means more cooling effort. |
| Power Consumption (%) | Percentage of the GPU’s maximum power limit being drawn. | Crucial for power stability and identifying thermal limits related to power. |
| Bus Interface Load | Utilization of the PCIe interface. | Helps detect if data transfer between GPU and CPU is a bottleneck. |
Advanced Features and Troubleshooting with GPU-Z
Beyond basic information and real-time monitoring, GPU-Z offers several advanced features that are invaluable for power users, overclockers, and those troubleshooting system issues.
Render Test and PCIe Lane Verification
On the “Graphics Card” tab, there’s a small “Render Test” button (usually a question mark icon next to the “Bus Interface” field). Clicking this initiates a lightweight 3D render test, which puts a minimal load on your GPU. While it’s not a full-fledged stress test, it’s useful for verifying that your GPU is actually running on the correct PCI-Express lane configuration (e.g., x16 rather than x8 or x4). If your PCIe bandwidth drops under load, this test can highlight it. This is especially important for ensuring that other components, such as M.2 SSDs, are not inadvertently reducing your GPU’s available PCIe lanes.
Validation and Screenshot Features
GPU-Z includes a “Validation” tab where users can submit their GPU information and sensor logs to the TechPowerUp website. This generates a unique validation ID, which can be useful for comparing configurations, bug reporting, or simply sharing your GPU’s specifications with others. Additionally, a screenshot button is available to quickly capture and save an image of the current GPU-Z tab, making it easy to share your findings without leaking unrelated windows.
BIOS Backup
A particularly powerful feature for enthusiasts is the ability to create a backup of your graphics card’s BIOS. This can be crucial for recovering from a corrupted vBIOS flash or for safely experimenting with custom BIOS versions. Always exercise caution when flashing a BIOS and ensure you have a verified backup.
Troubleshooting and Optimization
GPU-Z is an excellent tool for diagnosing various GPU-related issues:
- Thermal Throttling: By observing GPU temperature and clock speeds in the “Sensors” tab during intensive tasks (like gaming or benchmarking), you can identify if your GPU is overheating and throttling its performance. Sustained temperatures above 85°C under load warrant investigation, although brief spikes to 92°C can be normal for modern GPUs. If throttling occurs, solutions might include improving case airflow, adjusting fan curves, or undervolting the GPU.
- Bottlenecks: If your GPU load remains low during demanding applications, while your CPU usage is high, GPU-Z can help identify a CPU bottleneck. Conversely, if GPU load is consistently at 99-100% and performance is still unsatisfactory, it might indicate the GPU itself is the limiting factor for your desired settings.
- Driver Issues: Inconsistent clock speeds or missing sensor data in GPU-Z can sometimes point to outdated or corrupt graphics drivers. Updating your GPU drivers is often the first troubleshooting step.
- Fake GPUs: GPU-Z is also known for its ability to help detect counterfeit graphics cards by displaying genuine hardware specifications. Discrepancies between what your system reports and what GPU-Z displays can signal potential counterfeit hardware.
- Overclocking Stability: While GPU-Z doesn’t perform overclocking itself, it’s an indispensable companion for overclocking utilities like MSI Afterburner. It provides real-time feedback on clock speeds, temperatures, voltage, and power consumption, allowing you to monitor the stability and performance impact of your overclocks.
For more in-depth analysis and to correlate model performance with resource usage, you can explore detailed insights on GPU acceleration and real-time monitoring. For further reading, Wikipedia’s entry on Graphics Processing Units provides comprehensive information on GPU architecture and functionality.
Comparing GPU-Z with Other Monitoring Tools
The landscape of hardware monitoring tools is diverse, and while GPU-Z is exceptional for GPU-specific data, it’s helpful to understand how it fits into the broader ecosystem:
- MSI Afterburner: Primarily known for its robust overclocking and fan control capabilities, MSI Afterburner also offers real-time GPU monitoring and customizable on-screen displays during gameplay. While GPU-Z is read-only, Afterburner allows you to adjust parameters.
- HWiNFO: This is a highly comprehensive system monitoring tool that provides in-depth details about almost every hardware component, including detailed GPU sensors. HWiNFO offers broader system overview and logging features than GPU-Z, but can have a slightly steeper learning curve.
- HWMonitor: A lightweight and portable tool that provides real-time monitoring of GPU temperature, fan speed, voltage, and clock speed. It’s simpler than HWiNFO, and while good for basic monitoring, it lacks the advanced features and detailed GPU specs of GPU-Z.
- Open Hardware Monitor: An open-source alternative that monitors GPU and CPU performance, temperatures, and fan speeds. It’s lightweight and easy to use but offers less GPU-specific detail compared to GPU-Z.
- NVIDIA System Management Interface (nvidia-smi): A command-line tool included with NVIDIA drivers, primarily used for NVIDIA data center and professional GPUs. It’s highly accurate and preferred for servers and scripting, offering over 100 metrics unavailable through standard monitoring. While powerful, it lacks the graphical interface and user-friendliness of GPU-Z for desktop users.
- CPU-Z: Focuses on CPU, RAM, and motherboard information. GPU-Z is often used in conjunction with CPU-Z for a complete picture of system functioning.
In essence, GPU-Z excels in providing precise, granular, and static-to-dynamic GPU-specific information with minimal overhead. It’s ideal for quick hardware audits, verifying authenticity, and deep-diving into GPU specifications and real-time sensor data, particularly for troubleshooting and validation. While it doesn’t offer overclocking controls or comprehensive system-wide monitoring like some alternatives, its focused approach makes it an essential tool in any PC enthusiast’s arsenal.
Conclusion
GPU-Z stands as an indispensable utility for anyone seeking to understand and monitor their graphics card with professional-level precision. From its straightforward installation to its comprehensive display of hardware specifications and vital real-time sensor data, it empowers users to gain unprecedented insight into their GPU’s health and performance. Whether you’re validating a new purchase, diagnosing mysterious performance dips, fine-tuning for optimal gaming experiences, or simply satisfying your curiosity about the sophisticated technology powering your visuals, GPU-Z provides the authoritative data you need. Its lightweight nature, read-only operation, and focused feature set make it a safe, efficient, and highly effective tool, cementing its place as a cornerstone in the toolkit of PC enthusiasts, gamers, and professionals alike. By mastering GPU-Z, you move beyond guesswork, transforming into a pro at monitoring and maintaining one of your system’s most critical components.