GPU-Z: 12 Expert Tips for Graphics Card Monitoring and Analysis
Table of Contents
GPU-Z is a lightweight yet immensely powerful utility developed by TechPowerUp, designed to provide in-depth information and real-time monitoring of your graphics processing unit (GPU) and video card. Since its inception, this freeware has become an indispensable tool for PC enthusiasts, gamers, overclockers, and IT professionals seeking granular details about their graphics hardware. Unlike many other monitoring tools, GPU-Z excels in presenting a wealth of data in a concise and user-friendly manner, making it a go-to choice for diagnosing performance issues, verifying specifications, and keeping a close eye on critical operating parameters.
Introduction to GPU-Z
GPU-Z serves as a comprehensive diagnostic and monitoring utility specifically tailored for graphics cards. It offers a detailed breakdown of your GPU’s specifications, including its model name, architecture, manufacturing process, die size, transistor count, and DirectX support. Beyond static specifications, one of its most critical functionalities lies in its real-time sensor monitoring capabilities. Users can observe dynamic metrics such as GPU core temperature, memory temperature, clock speeds (core, memory, and shader), fan speeds, GPU utilization, and power consumption. This real-time data is crucial for understanding how a GPU performs under various loads, identifying potential thermal throttling, or simply validating an overclock.
The utility’s design philosophy prioritizes precision, speed, and a minimal footprint. It typically requires no installation, offering a portable executable that can be run directly from a USB stick, making it highly convenient for technicians working on multiple systems. GPU-Z supports a wide array of graphics devices from major manufacturers, including NVIDIA, AMD (and legacy ATI models), and Intel, ensuring broad compatibility across the vast PC hardware landscape. Its ability to provide accurate and reliable data has solidified its reputation as a gold standard in GPU diagnostics.
The Origin and Evolution of GPU-Z
GPU-Z was first introduced in 2007 by TechPowerUp, a prominent online resource for PC hardware news, reviews, and utilities. The inspiration for GPU-Z came from the popular CPU-Z utility, which provides detailed information about central processing units. TechPowerUp secured explicit permission from CPU-Z’s author, Franck, to use a similar naming convention, aiming to create a complementary tool for graphics hardware. From its inception, the goal was to develop a lightweight application that could deliver deep insights into GPU performance and metrics, addressing a gap in detailed graphics card information that generic tools often overlooked.
Over the years, GPU-Z has consistently evolved, with TechPowerUp regularly releasing updates to ensure compatibility with the latest GPU architectures, driver versions, and operating systems. For instance, recent versions have added support for cutting-edge technologies like PCIe Resizable BAR. The software remains free for personal and commercial use, and its continuous development reflects TechPowerUp’s commitment to providing an accurate and reliable tool for the PC community. This ongoing dedication to updates ensures that GPU-Z remains relevant and effective, supporting new NVIDIA, AMD, and Intel GPUs as they hit the market.
Core Features and Interface Overview
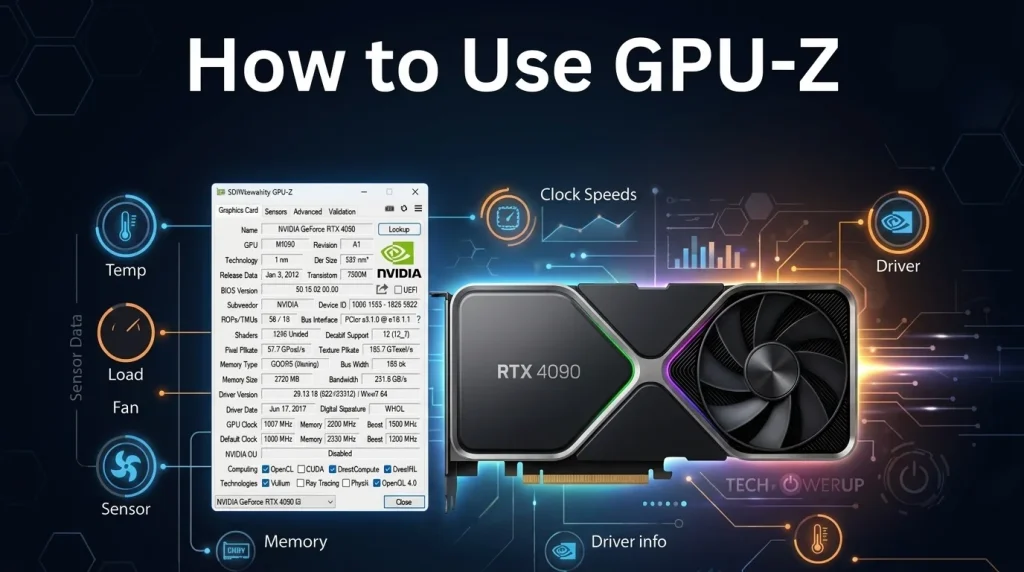
The GPU-Z interface is characterized by its simplicity and tabbed design, making it straightforward to navigate even for those new to hardware monitoring. Upon launching the application, users are greeted with a compact window featuring several key tabs: “Graphics Card,” “Sensors,” “Advanced,” and “Validate”. Each tab serves a distinct purpose, offering different layers of information about the installed graphics hardware.
- Graphics Card Tab: This is the initial view, presenting a summary of the GPU’s fixed specifications. It includes the GPU name, revision, technology process, die size, release date, BIOS version, device ID, subvendor, bus interface, shader count, DirectX support, pixel fillrate, texture fillrate, memory type, memory size, memory bus width, bandwidth, driver version, and driver date. This tab also displays the default clock speeds, GPU clock, memory clock, and shader clock, along with boost clocks if applicable. A useful “Lookup” button allows users to quickly access a web page with more detailed information about their specific graphics card model.
- Sensors Tab: Arguably the most dynamic and frequently used tab, “Sensors” provides real-time monitoring of various GPU parameters. This includes GPU temperature, GPU core clock, GPU memory clock, GPU load, memory controller load, video engine load, bus interface load, fan speed (RPM and percentage), power consumption, and various voltage readings. Users can also log these sensor readings to a file for later analysis. This data is invaluable for identifying bottlenecks, assessing cooling efficiency, and understanding power delivery.
- Advanced Tab: This tab offers more intricate details categorized under various dropdown menus. These categories can include information about OpenCL, NVIDIA CUDA, AMD CrossFire, NVIDIA SLI, Vulkan, DirectX, and other specific technologies or APIs supported by the GPU. It provides a deeper dive into the GPU’s capabilities and driver-specific information that might not be immediately obvious from the other tabs.
- Validation Tab: This feature allows users to submit their GPU information to TechPowerUp’s online database. This is particularly useful for verifying the authenticity of a graphics card, especially in the context of second-hand purchases, and helps to detect fake GPUs. It generates a unique validation ID, providing a public record of the card’s specifications.
Understanding the Graphics Card Tab
The “Graphics Card” tab is the foundational display in GPU-Z, presenting a static snapshot of your GPU’s fundamental characteristics. This information is critical for anyone looking to understand their hardware at a technical level, from comparing specifications for an upgrade to confirming system requirements for a new game.
Key data points displayed here include:
- GPU Name and Codename: Identifies the specific GPU model and its internal development codename.
- Revision and Technology: Details the specific iteration of the GPU chip and the manufacturing process (e.g., 7nm, 14nm) used to produce it.
- Die Size and Transistors: Provides insight into the physical size of the GPU chip and the number of transistors it contains, which are key indicators of its complexity and potential performance.
- Release Date: Indicates when the GPU was originally launched, helping to gauge its age and relevance.
- BIOS Version: Shows the firmware version running on the graphics card, useful for troubleshooting or VBIOS updates. GPU-Z also has a feature to backup your graphics card BIOS.
- Device ID and Subvendor: Unique identifiers for the GPU and the specific manufacturer of the graphics card (e.g., ASUS, MSI, Gigabyte).
- Bus Interface: Specifies the PCIe generation and lane configuration (e.g., PCIe 4.0 x16), which affects the data transfer speed between the GPU and the motherboard. GPU-Z includes a GPU load test to verify PCI-Express lane configuration.
- Shaders and DirectX Support: Indicates the number of shader units and the highest DirectX version supported by the GPU, crucial for game compatibility and rendering capabilities.
- Pixel Fillrate and Texture Fillrate: Metrics that represent the GPU’s ability to process pixels and textures per second, providing an approximation of its rendering power.
- Memory Type, Size, Bus Width, and Bandwidth: Critical details about the video memory (VRAM), including its technology (e.g., GDDR6, GDDR6X), total capacity, the width of the memory bus (e.g., 256-bit), and the maximum theoretical data transfer rate. These factors significantly impact performance, especially in high-resolution gaming and demanding professional applications.
- Driver Version and Date: Displays the currently installed graphics driver version and its release date, essential for ensuring you have the latest and most stable drivers.
By thoroughly examining the information presented in this tab, users can quickly ascertain the capabilities of their graphics card and compare it against published specifications or other models.
Real-Time Sensor Monitoring and Logging
The “Sensors” tab is where GPU-Z truly shines for active system monitoring and diagnostics. This section provides a dynamic view of your GPU’s operational state, updating every second to reflect real-time changes. Monitoring these sensors is vital for maintaining optimal performance, preventing damage from overheating, and troubleshooting instability issues.
Key sensor readings include:
- GPU Temperature: The most commonly monitored metric, indicating the core temperature of the graphics processing unit. High temperatures can lead to thermal throttling, where the GPU automatically reduces its clock speed to prevent damage. GPU-Z provides real-time thermal monitoring.
- GPU Core Clock, Memory Clock: Displays the current operating frequencies of the GPU core and memory, which can fluctuate based on workload and power management settings. These are often higher than the default clocks when the GPU is under load (boost clocks).
- GPU Load: Shows the percentage of the GPU being utilized. High GPU load (near 100%) during gaming or demanding tasks is generally desirable, indicating the GPU is working hard. If the load is low while performance is poor, it might suggest a bottleneck elsewhere in the system (e.g., CPU, RAM).
- Memory Controller Load / Video Engine Load: Provides insight into the utilization of specific components within the GPU, helping to pinpoint bottlenecks related to memory access or video decoding/encoding tasks.
- Bus Interface Load: Monitors the utilization of the PCIe bus interface, indicating how much data is being transferred between the GPU and the rest of the system. This can reveal if the PCIe slot or connection is limiting performance.
- Fan Speed (RPM & %): Displays the rotational speed of the GPU cooling fans in revolutions per minute (RPM) and as a percentage of their maximum speed. This helps assess the effectiveness of the cooling solution and can be an indicator of thermal stress.
- Power Consumption (Board Power Draw): Shows the power being drawn by the entire graphics card, often segmented into GPU-only power and total board power. This is crucial for understanding power efficiency and ensuring your power supply unit (PSU) can adequately handle the load.
- GPU Voltage: The voltage supplied to the GPU core. Monitoring this can help identify power delivery issues, especially during overclocking or when dealing with unstable systems.
One of the standout features of the “Sensors” tab is its ability to log data to a file. By checking the “Log to file” checkbox, users can record all displayed sensor data over time into a text file, typically in CSV format. This logged data can then be analyzed in spreadsheet software like Microsoft Excel or dedicated log viewers, providing a historical record of GPU performance and behavior during extended gaming sessions, benchmarks, or stress tests. This feature is invaluable for diagnosing intermittent issues or long-term performance trends.
| Metric | Description | Significance |
|---|---|---|
| GPU Temperature | Current temperature of the graphics chip. | High temps (e.g., >85°C) can cause thermal throttling, reducing performance and potentially shortening hardware lifespan. Critical for monitoring cooling efficiency. |
| GPU Core Clock | Operating frequency of the GPU processing units. | Higher clocks generally mean better performance. Fluctuations indicate dynamic boost behavior or throttling. |
| GPU Memory Clock | Operating frequency of the video memory. | Influences how quickly the GPU can access and process textures and other data. Essential for high-resolution gaming and complex workloads. |
| GPU Load | Percentage of GPU utilization. | A high percentage (near 100%) under load suggests the GPU is the bottleneck, which is often desirable for maximizing performance. Low load with poor performance indicates other system bottlenecks. |
| Fan Speed (RPM / %) | Speed of the GPU cooling fans in revolutions per minute and as a percentage of maximum. | Indicates cooling system activity. Higher speeds often correlate with higher temperatures or user-defined fan curves. Excessive noise or insufficient cooling can be identified. |
| Board Power Draw | Total power consumed by the graphics card. | Helps determine if the power supply unit (PSU) is adequate. Sudden drops can indicate power delivery issues. |
| GPU Voltage | Voltage supplied to the GPU core. | Crucial for overclocking stability. Significant voltage drops under load (vDroop) can lead to instability and crashes. |
| Memory Used | Amount of VRAM currently in use by applications. | Indicates how much of the dedicated video memory is being utilized. Nearing full capacity can lead to performance degradation or stuttering. |
Advanced Functionality and Troubleshooting
Beyond its core information and sensor monitoring, GPU-Z incorporates several advanced features that cater to deeper diagnostics and specialized use cases. The “Advanced” tab, as mentioned, provides granular details about various APIs and technologies, offering insights into driver capabilities and hardware support. This information can be invaluable for developers, benchmarkers, or users troubleshooting compatibility issues with specific applications.
One notable feature is the built-in GPU load test, which can be used to verify the PCI-Express lane configuration. This helps ensure that the graphics card is operating at its intended bus speed and bandwidth, preventing potential performance bottlenecks. For users experiencing system instability, monitoring the GPU during this load test can reveal issues related to power delivery (e.g., voltage droop) or thermal management.
GPU-Z also offers the capability to create a backup of your graphics card’s BIOS (VBIOS). This is a powerful feature for advanced users who might want to modify their VBIOS (e.g., for custom fan curves or power limits) or for troubleshooting in case of a corrupted BIOS. Having a backup allows for restoration to the original factory settings, providing a safety net for experimental modifications.
When troubleshooting, GPU-Z’s real-time sensor data is an invaluable first line of defense. For instance, if a game crashes or exhibits stuttering, observing the GPU temperature and clock speeds in GPU-Z can quickly reveal if thermal throttling is occurring. Similarly, unusually low GPU load during graphically intensive tasks might indicate a CPU bottleneck or a driver issue. By systematically examining the data provided across its tabs, users can often narrow down the root cause of performance anomalies. The ability to log sensor data over time is especially helpful for diagnosing intermittent problems that don’t occur immediately.
GPU-Z for Validation and Authenticity
In an era where counterfeit hardware can sometimes find its way into the market, GPU-Z provides a critical layer of defense through its validation features. The “Validate” tab allows users to submit their GPU information to TechPowerUp’s database. This submission generates a unique validation ID, which can then be shared or referenced. This process helps to verify that the graphics card’s reported specifications match those of legitimate models in the database, making it a valuable tool for detecting fake or misrepresented GPUs.
For those buying or selling second-hand graphics cards, GPU-Z validation can serve as a crucial authenticity check. A buyer can request a validation ID from the seller and cross-reference it with the official TechPowerUp database to ensure the product is genuine and its specifications are accurate. This transparency helps to build trust and mitigate the risks associated with hardware transactions.
Beyond fraud detection, the validation process also contributes to a larger, community-driven database of GPU specifications, which benefits all users by providing a comprehensive repository of hardware information. This collaborative effort helps to maintain GPU-Z’s accuracy and expand its support for new and obscure hardware variations.
GPU-Z vs. Alternatives
While GPU-Z is widely regarded as a leading utility for graphics card information, several other tools offer similar or complementary functionalities. Understanding their differences can help users choose the best tool for their specific needs.
HWiNFO (32/64): Often cited as the most comprehensive hardware monitoring tool available, HWiNFO provides extensive details about virtually every component in a system, including GPUs. It offers a wealth of sensor data, logging capabilities, and deep insights into hardware specifications. While incredibly powerful, its sheer volume of information can be overwhelming for casual users, and it might require more navigation compared to GPU-Z’s focused approach. Some versions of HWiNFO are not free, although a comprehensive free version exists.
MSI Afterburner: Primarily known as an overclocking utility, MSI Afterburner also includes robust hardware monitoring features with an on-screen display (OSD) for real-time data overlay during gaming. While it offers similar sensor data to GPU-Z, its main strength lies in its integrated overclocking and fan control capabilities. For users solely interested in detailed GPU specifications without overclocking, GPU-Z remains simpler and lighter.
Speccy: Developed by Piriform (creators of CCleaner), Speccy provides a clean interface for viewing detailed static hardware specifications of the entire system, including the GPU. It excels at presenting an organized overview of all installed components but offers less in terms of real-time sensor monitoring compared to GPU-Z or HWiNFO.
AIDA64: This is a powerful diagnostic and benchmarking tool that provides exhaustive hardware information, stress testing, and hardware monitoring, including detailed GPU data. While AIDA64 is very comprehensive, it is a commercial software with a trial period, unlike the perpetually free GPU-Z.
CPU-Z: The spiritual predecessor to GPU-Z, CPU-Z focuses specifically on central processing units and system memory, providing detailed information about them. While essential for CPU monitoring, it does not cover graphics card specifics, highlighting why GPU-Z was created as a complementary tool.
Manufacturer-Specific Software: NVIDIA GeForce Experience and AMD Radeon Software (with WattMan) offer basic monitoring capabilities integrated into their driver packages. These are convenient for basic checks but typically lack the granular detail and diagnostic depth provided by a dedicated utility like GPU-Z.
In essence, GPU-Z stands out for its lightweight design, no-installation portability, and highly focused, accurate, and real-time information specifically on graphics cards. While alternatives offer broader system monitoring or integrated overclocking, GPU-Z remains the gold standard for dedicated GPU diagnostics due to its precision, minimal overhead, and user-friendly presentation. For a more detailed comparison of hardware monitoring tools, Wikipedia offers a comprehensive overview of various utilities.
Conclusion
GPU-Z, developed by TechPowerUp, has firmly established itself as an indispensable utility for anyone interacting with graphics hardware. From its humble beginnings as a counterpart to CPU-Z, it has evolved into a robust, lightweight, and highly accurate tool providing a wealth of information about graphics processing units. Its ability to deliver detailed static specifications, coupled with real-time sensor monitoring, logging capabilities, and validation features, makes it a vital asset for diagnosing performance issues, verifying hardware authenticity, and ensuring optimal operation of your graphics card.
Whether you are a casual user curious about your GPU’s capabilities, a passionate gamer striving for peak performance, an overclocker pushing hardware limits, or an IT professional troubleshooting complex systems, GPU-Z offers the precise and reliable data you need. Its continued development and broad support for NVIDIA, AMD, and Intel GPUs ensure that it remains a relevant and essential component in the toolkit of any PC enthusiast or professional. In a world where understanding your hardware is key to maximizing your computing experience, GPU-Z remains a clear, concise, and powerful solution.